
Building An SVG Map With Vue.js
This article provides a simple example of using Vue.js to work with SVG graphics.

Why Vue.js?
Vue.js provides practical ways to create component-based dynamic user interfaces where you can powerfully control and manage DOM elements. You can easily update and manage various SVG elements - dynamically - using only a small subset of the features. It also allows you to group related SVG elements and compose them.
For example we will use SVG of world continents.
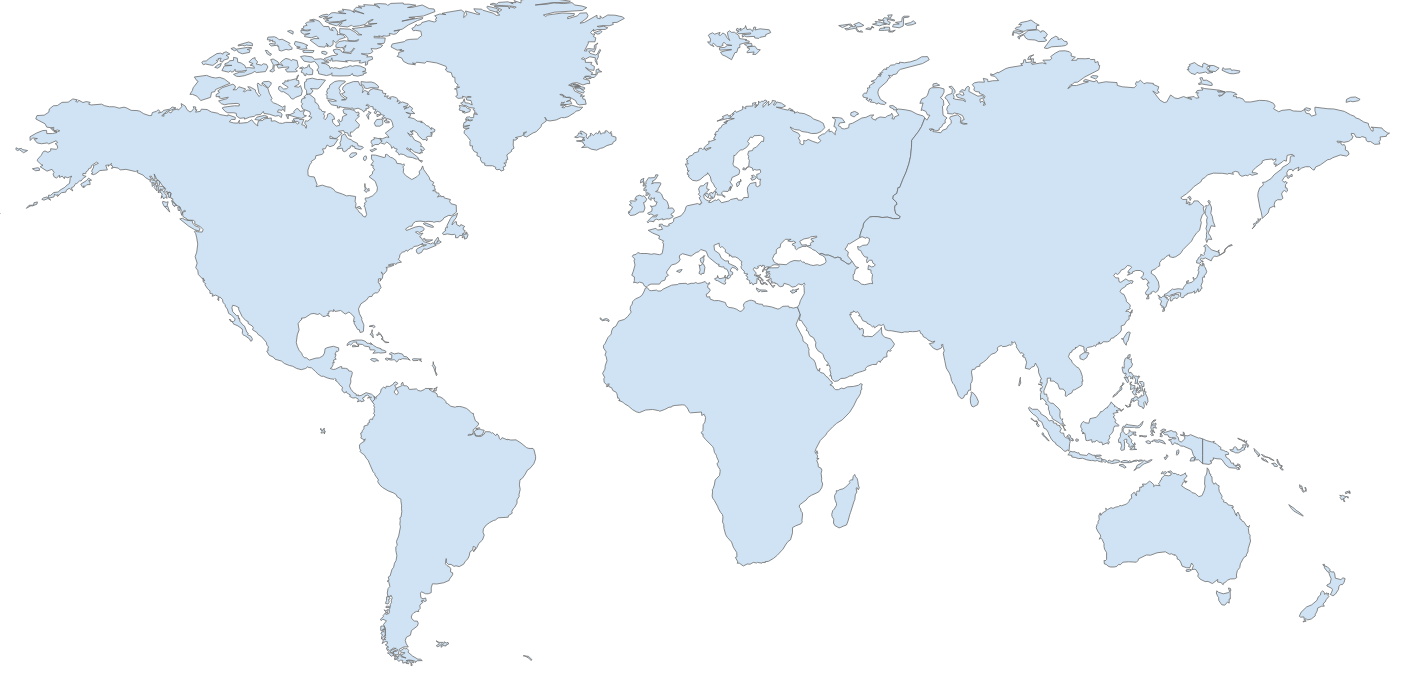
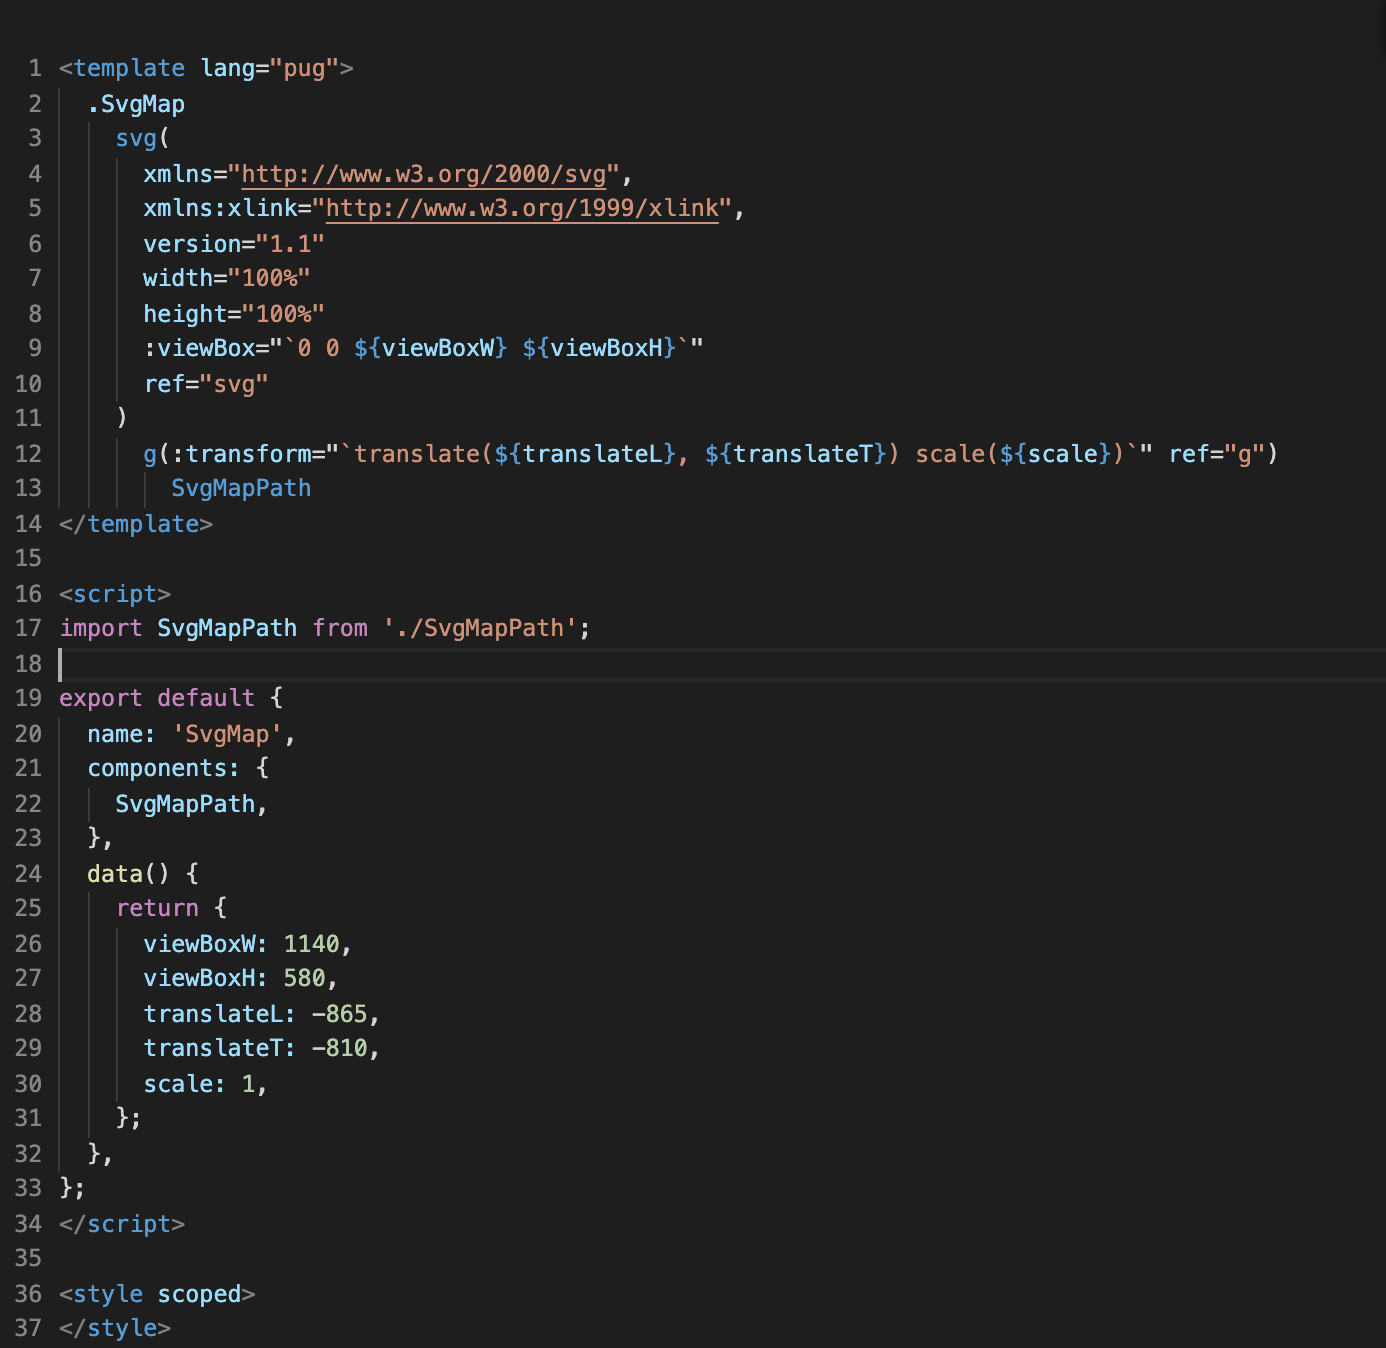
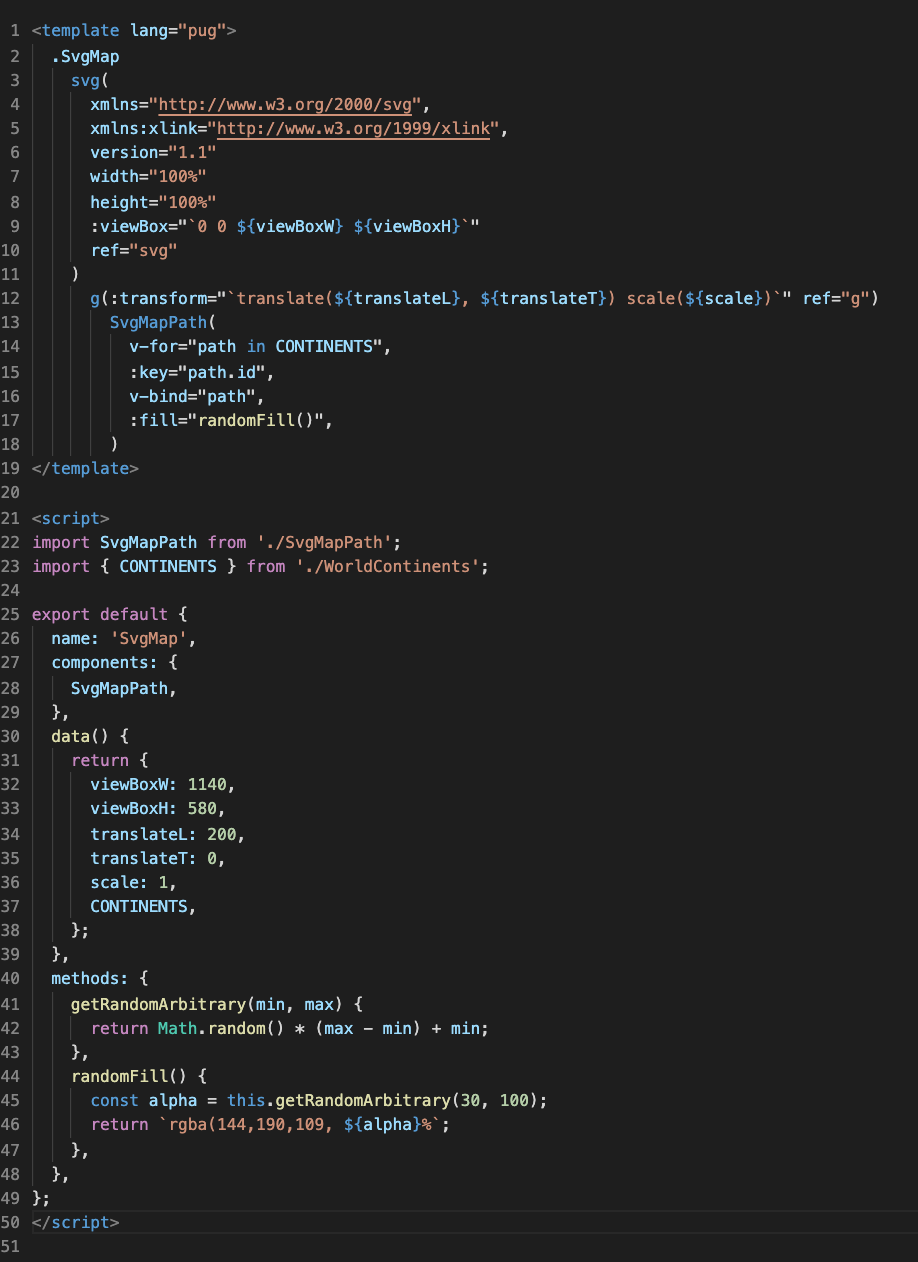
SvgMap.vue
The component will consist of two files, the main component will be called, for example, SvgMap.vue - this is our file in which we will keep the main SVG hierarchy.
<template lang="pug">
  .SvgMap
    svg(
      xmlns="http://www.w3.org/2000/svg",
      xmlns:xlink="http://www.w3.org/1999/xlink",
      version="1.1"
      width="100%"
      height="100%"
      :viewBox="`0 0 ${viewBoxW} ${viewBoxH}`"
      ref="svg"
    )
      g(:transform="`translate(${translateL}, ${translateT}) scale(${scale})`" ref="g")
        SvgMapPath
</template>

<script>
import SvgMapPath from './SvgMapPath';

export default {
  name: 'SvgMap',
  components: {
    SvgMapPath,
  },
  data() {
    return {
      viewBoxW: 1140,
      viewBoxH: 580,
      translateL: -865,
      translateT: -810,
      scale: 1,
    };
  },
};
</script>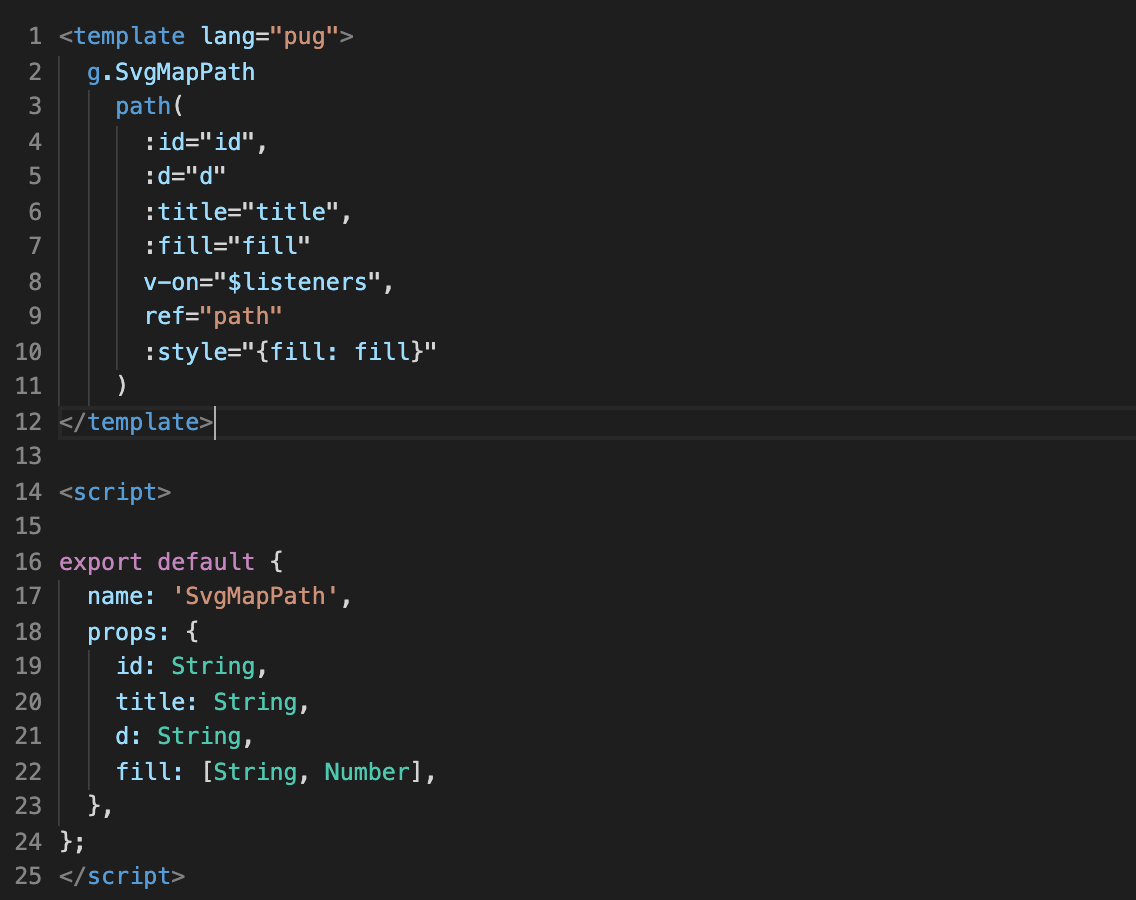
SvgMapPath.vue
SvgMapPath.vue - component for one path.
<template lang="pug">
  g.SvgMapPath
    path(
      :id="id",
      :d="d"
      :title="title",
      :fill="fill"
      v-on="$listeners",
      ref="path"
      :style="{fill: fill}"
    )
</template>

<script>

export default {
  name: 'SvgMapPath',
  props: {
    id: String,
    title: String,
    d: String,
    fill: [String, Number],
  },
};
</script>
After creating the main files, we’ll start working with the svg map file ,for example, we took the https://code.highcharts.com/mapdata/custom/world-continents.svg map, which is ideal and has all the information we need. Let's create the WorldContinents.js file where we will store the data of the continents in JSON.
export const CONTINENTS = [
{
id: 'EU',
title: 'Europe',
d: 'M358.9,97.6 L359.5,98.7 L359.2,100.1 L357.3,98.3 Z',
},
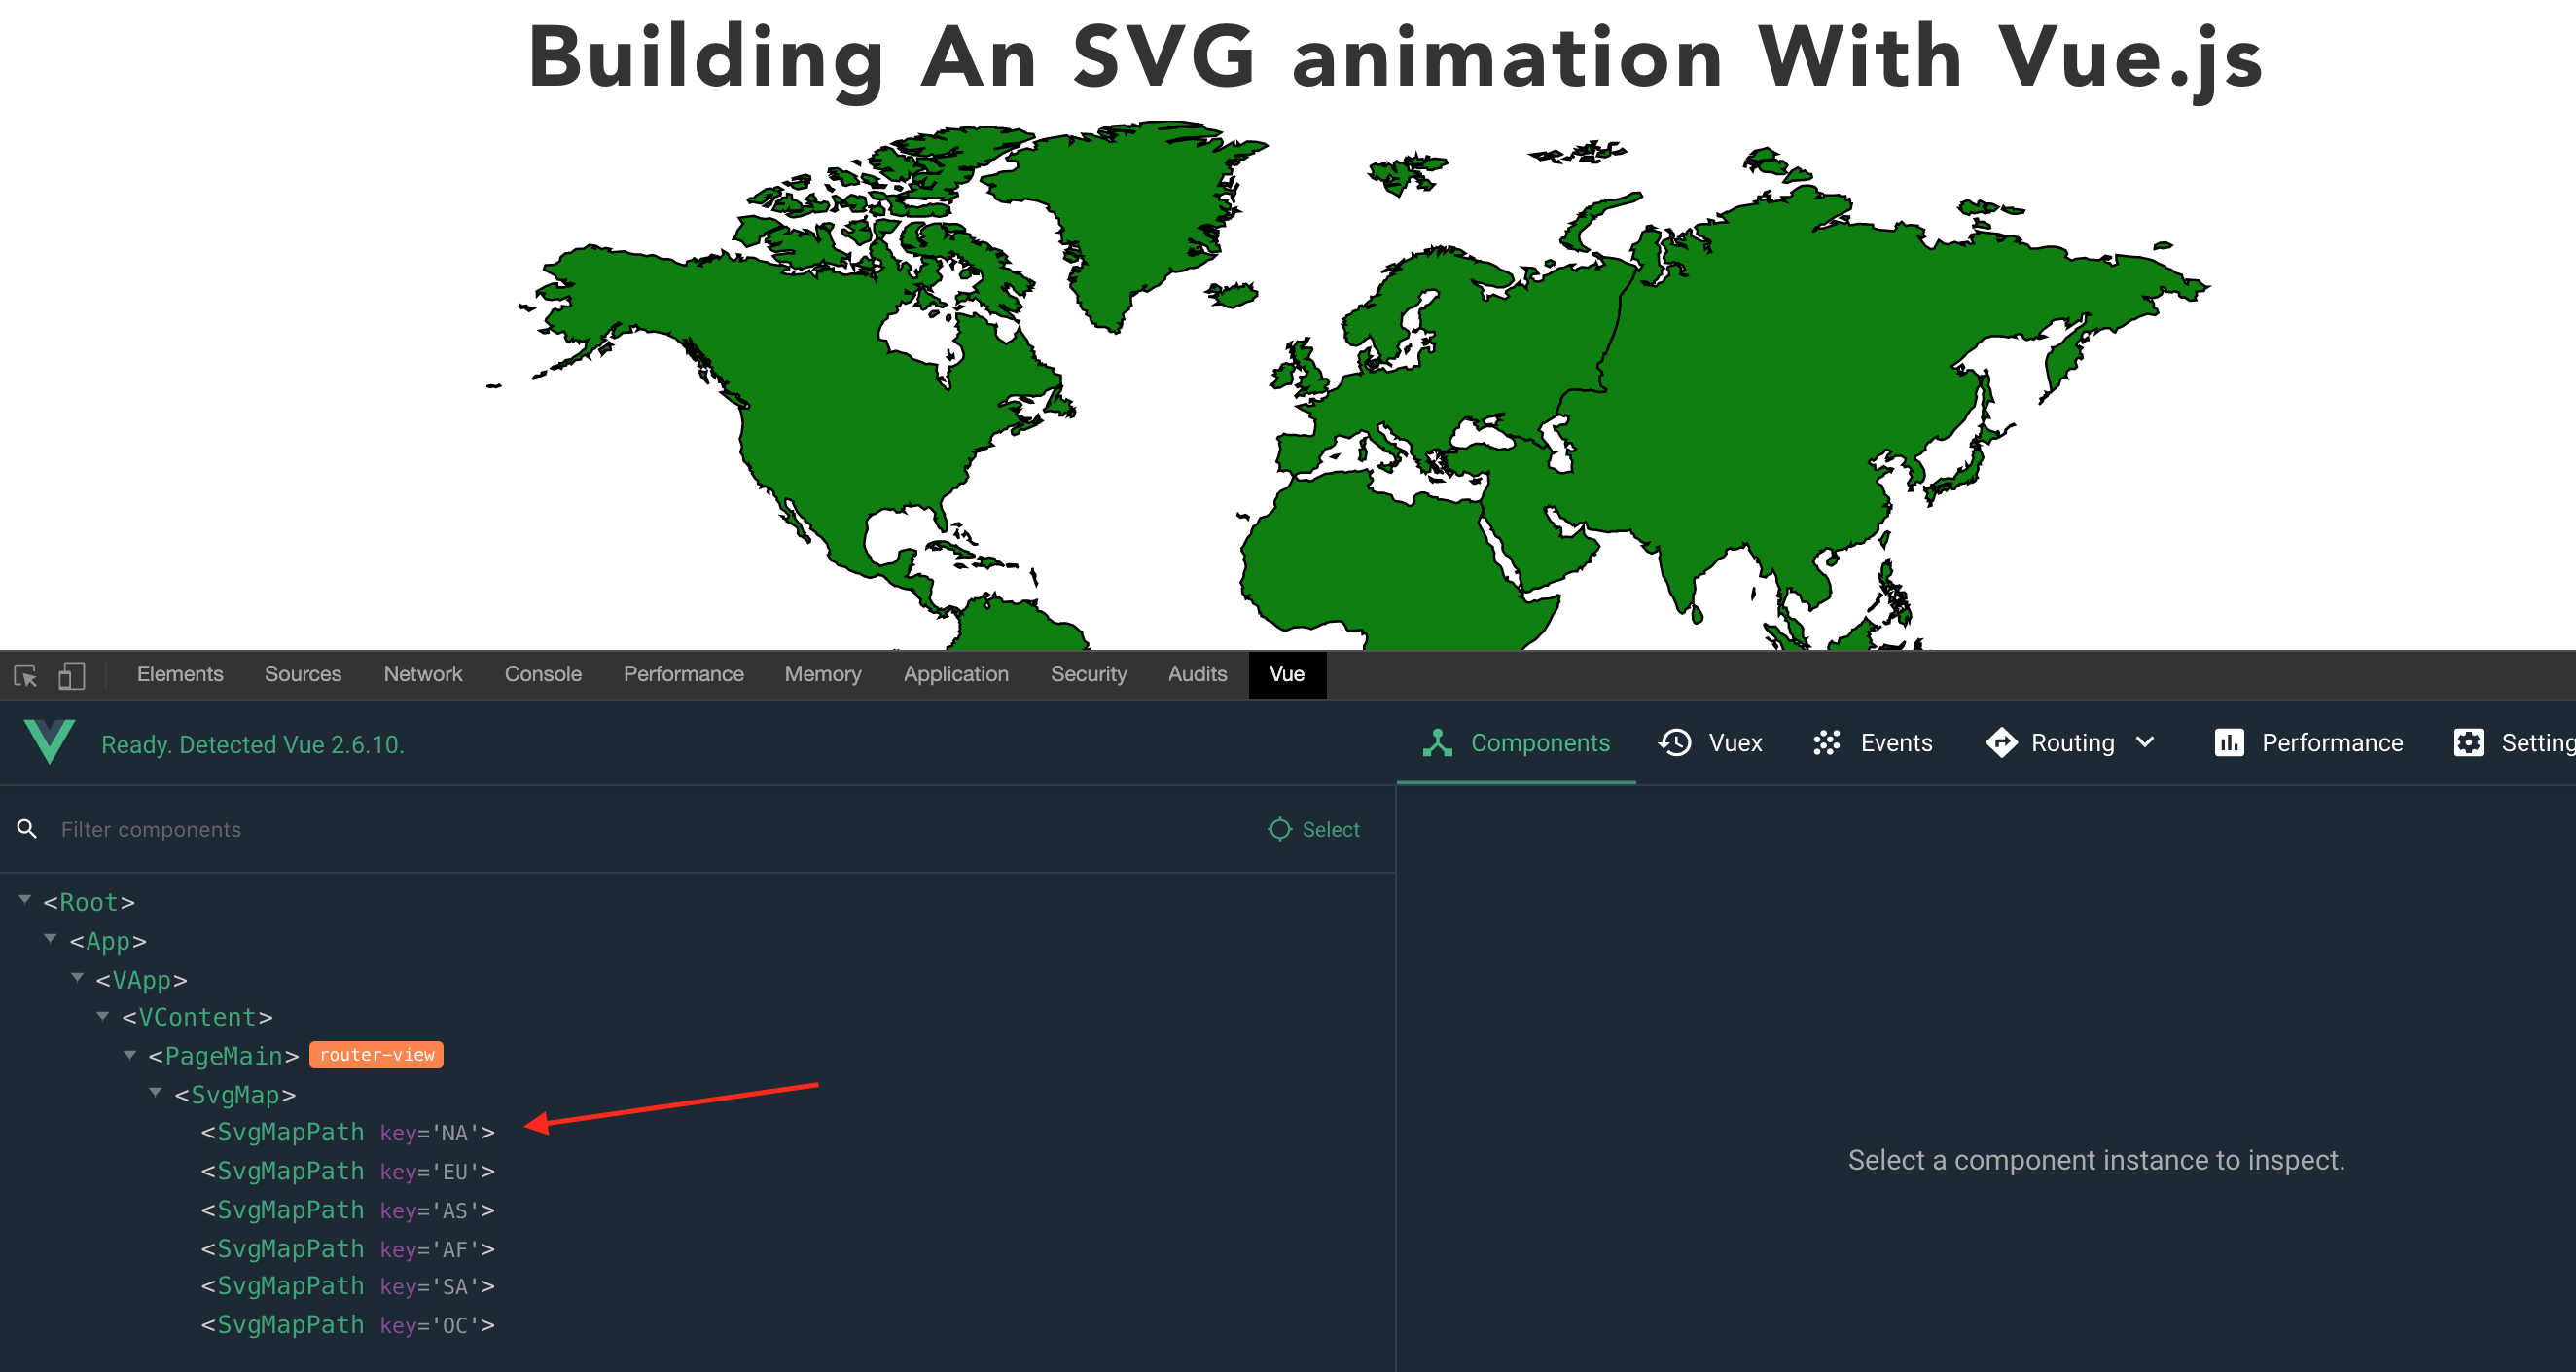
];Let's do v-for and pass the necessary parameters to SvgMapPath.
SvgMapPath(
    v-for="path in CONTINENTS",
    :key="path.id",
    v-bind="path",
)
In total, the basis is ready, and it is possible to work with each continent as a separate component. As an example, you can add different events:
- @mouseleave.native
- @mouseenter.native
- @mousemove.native
For example, lets change randomly with the mounted fill of the continent :create a random number function where you can set the minimum and maximum:
getRandomArbitrary(min, max) {
    return Math.random() * (max - min) + min;
},
And one more function for changing colors, the easiest way to do color is through rgba, where the random number will act as opacity:
randomFill() {
    const alpha = this.getRandomArbitrary(30, 100);
    return `rgba(144,190,109, ${alpha}%`;
},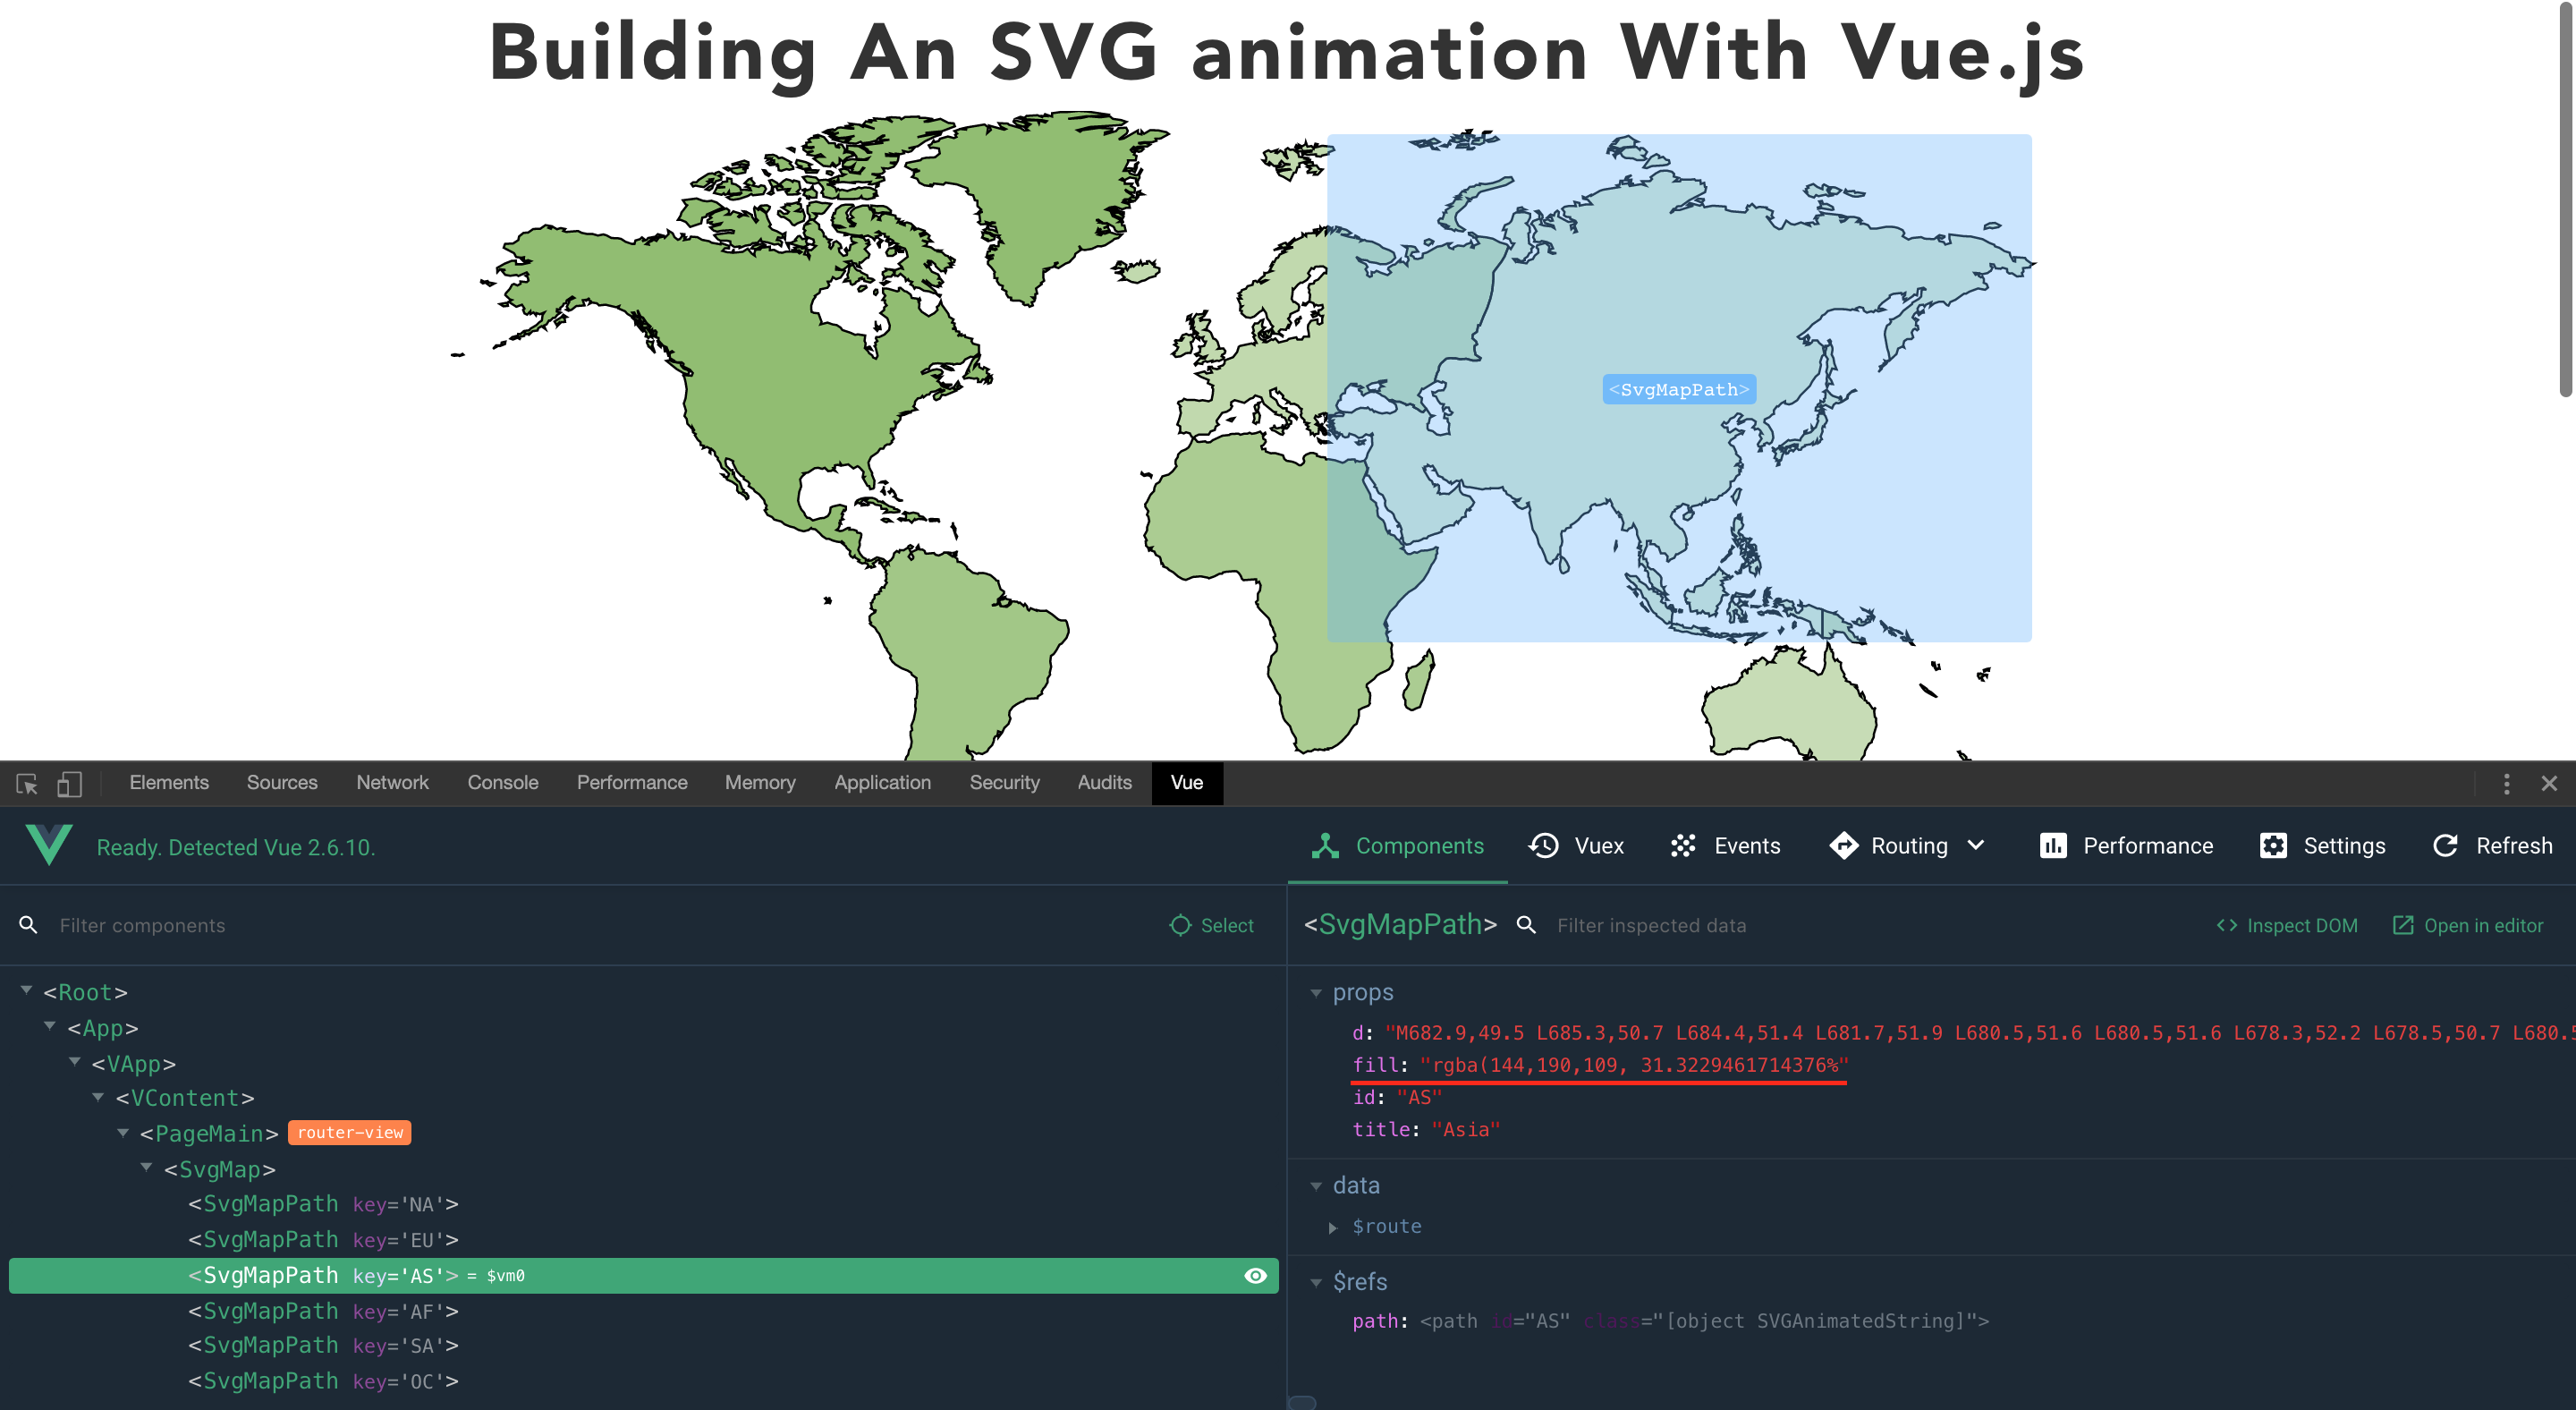
In the end, we got a pretty good base component for working with SVG cards.
Let's summarize:
Vue.js gives you great opportunities to work with SVG, this is just a small example that shows how easy it is to make friends VUE with SVG and make a functional map.